The Portfolio Feedback Loop: How to Use Visitor Data to Land Your Next Role


In the competitive landscape of 2026, your portfolio is no longer a static digital business card. It's a dynamic, interactive tool—a living document of your professional journey. Yet, for years, creating one has been an act of faith. You spend hours curating projects, writing case studies, and designing layouts, only to send it into the void, hoping a recruiter sees it and gets it. You're left with questions: Did they look at your best work? Which link did they click? Did they even scroll past the hero section?
This guessing game is over. A new paradigm is emerging, fueled by data and a concept borrowed from product development: the feedback loop. Just as tech companies use A/B testing and user analytics to optimize their products, forward-thinking professionals are now applying the same principles to their personal brands. They're moving from a "set-it-and-forget-it" mindset to a strategic, iterative process of portfolio optimization.
Recent discussions on platforms like LinkedIn and Blind are buzzing with terms like "portfolio intelligence." A February 2026 report from The Future of Hiring newsletter revealed a striking trend: candidates who actively use analytics to test and refine their portfolio content are seeing callback rates up to 40% higher than those with static pages. The message is clear: in a data-driven world, leaving your career trajectory to chance is a strategic misstep.
This article will guide you through building your own Portfolio Feedback Loop—a systematic approach to using visitor data to understand recruiter behavior, make informed improvements, and ultimately, land your next role.
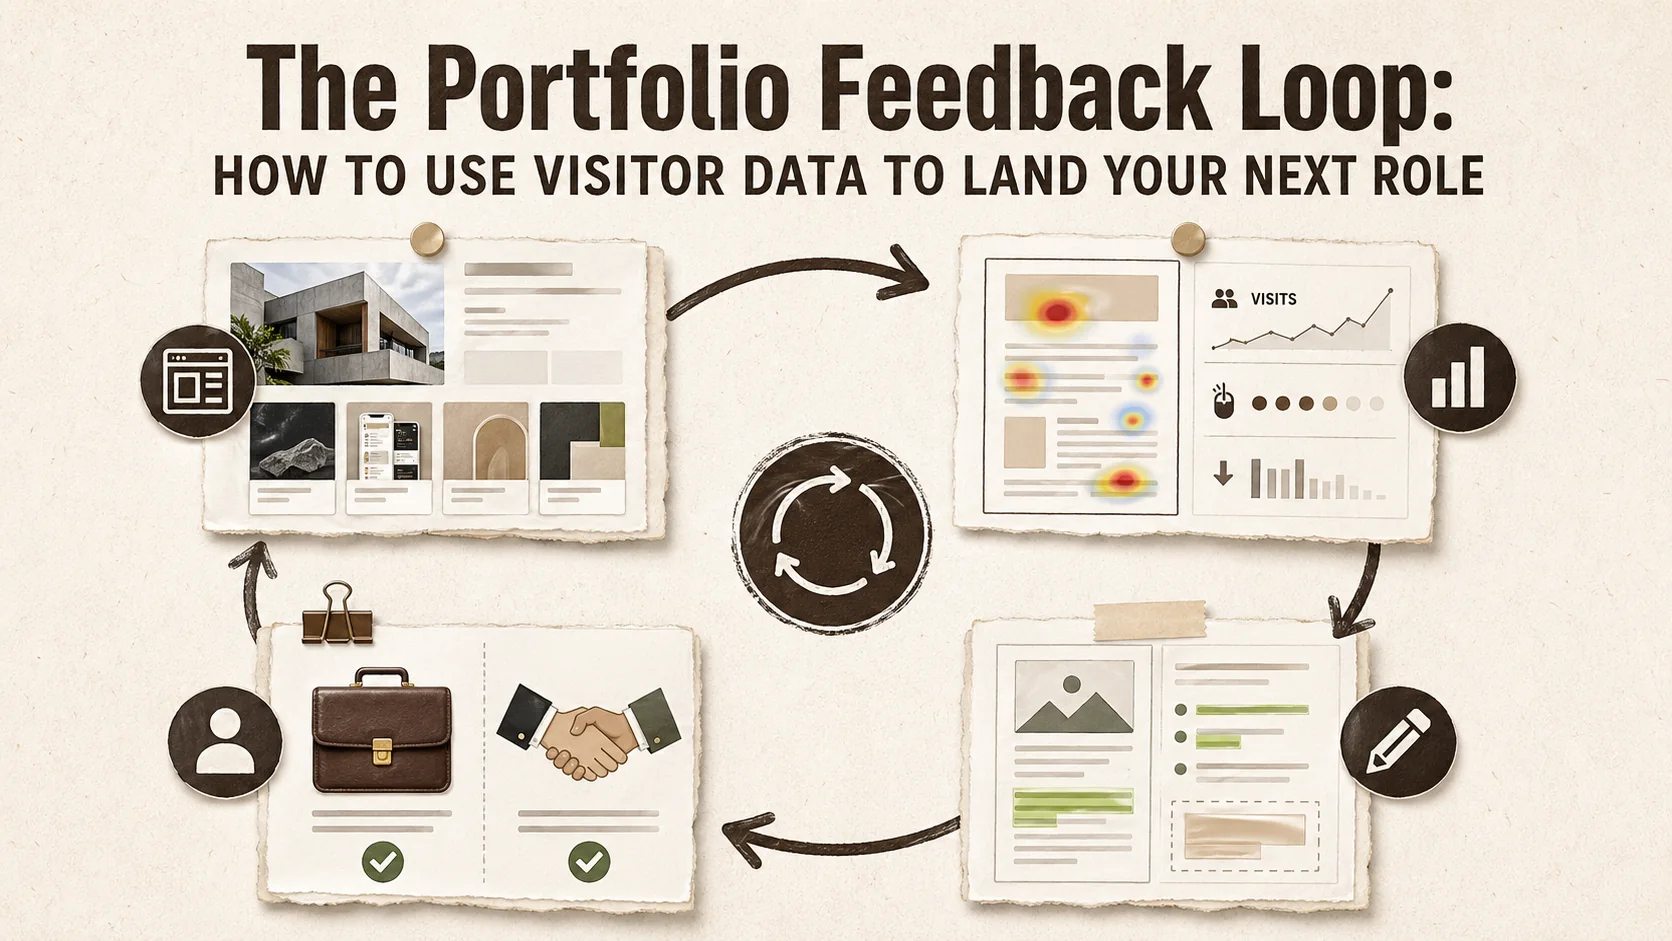
What is a Portfolio Feedback Loop?
A portfolio feedback loop is a continuous cycle where visitor analytics inform design and content changes, which then generate new data to optimize further. Candidates who adopt this approach see up to 40% higher callback rates, according to 2026 hiring trend reports.
At its core, a feedback loop is a process where the outputs of a system are circled back as inputs, used to modify and improve the system's future performance.
In the context of your portfolio:
- You publish your portfolio with specific content and structure.
- You collect data on how visitors (especially recruiters and hiring managers) interact with it.
- You analyze that data to gain insights into what's working and what's not.
- You implement changes based on those insights to improve the portfolio's effectiveness.
- The loop repeats, creating a cycle of continuous refinement.
This transforms your portfolio from a passive showcase into an active participant in your job search. You're no longer shouting into the dark; you're having a measured, evidence-based conversation with your target audience.
The Critical Data Points: What to Track and Why
The five metrics that matter most are visitor sources, page views, click-through rates on links, scroll depth and heatmaps, and bounce rate combined with time on page. Together, these reveal exactly how recruiters interact with your portfolio.
Not all data is created equal. To build an effective feedback loop, you need to focus on metrics that directly correlate with recruiter engagement and intent. Here are the key data points you should be tracking:
1. Visitor Sources & Acquisition Channels
- What it is: Where your traffic is coming from -- LinkedIn, GitHub, Dribbble, Behance, a direct link in your email signature, or a specific job board.
- Why it matters: This tells you which platforms or outreach methods are most effective at driving qualified traffic. If 70% of your views come from your LinkedIn profile, you know to double down there. If a link in your cold email gets zero clicks, you might need to rephrase your call-to-action. Understanding your portfolio's first impression starts with knowing where visitors come from.
2. Page Views & Unique Visitors
- What it is: The total number of times your page is loaded (views) and the number of distinct individuals visiting (unique visitors).
- Why it matters: It measures raw reach. A spike in unique visitors after you apply for a job or post on social media confirms your efforts are driving traffic.
3. Click-Through Rates (CTR) on Links
- What it is: The percentage of visitors who click on a specific link (e.g., your GitHub, a case study PDF, your contact form).
- Why it matters: This is arguably the most important metric. It reveals content priority. If your "Project Alpha" case study link has a 25% CTR while "Project Beta" has only 5%, it's a strong signal that Alpha is more compelling to your audience. This allows you to highlight similar work or de-emphasize less engaging projects.
4. Scroll Depth & Heatmaps (Advanced)
- What it is: How far down the page visitors scroll and a visual map of where they click, move, and look. Services like Hotjar and Microsoft Clarity provide this for included.
- Why it matters: It uncovers engagement zones. You might find that 80% of visitors never scroll past your third project, meaning your best work needs to be "above the fold." A heatmap might show that people are frequently clicking on an image that isn't linked, indicating a missed opportunity. This ties directly into the first 5 seconds rule that determines whether recruiters stay or bounce.
5. Bounce Rate & Time on Page
- What it is: The percentage of visitors who leave after viewing only one page (bounce) and the average time they spend engaged with your content.
- Why it matters: These are engagement quality indicators. A very high bounce rate could mean your page isn't immediately relevant to what visitors expected (a mismatch with the link they clicked). A longer average time on page suggests your content is holding their attention.
For a deeper dive into which metrics recruiters care about most, explore our guide on portfolio metrics that matter to recruiters. If you want to see how these metrics connect to the broader first click test, that guide covers the recruiter scan path in detail.
Building Your Loop: A 4-Step Action Plan
The four steps are: instrument your portfolio with analytics, establish a baseline over 1--2 weeks, analyze and A/B test changes, then close the loop with proactive outreach based on visitor signals.
Now, let's translate this data into action. Here’s your step-by-step plan to implement a Portfolio Feedback Loop.
Step 1: Instrument Your Portfolio (Gather the Data)
First, you need the tools to collect data. Many modern portfolio builders, like Popout, come with built-in, privacy-compliant analytics dashboards. This is the easiest path. Alternatively, you can use tools like Google Analytics (with proper configuration) or dedicated heatmap services, though these often require more technical setup.
Action Item: Ensure your portfolio has analytics enabled. Familiarize yourself with the dashboard. Know where to find data on page views, traffic sources, and most importantly, link clicks.
Step 2: Establish a Baseline & Set Goals
Before making changes, you need to know your starting point. Share your portfolio link in your next 5-10 job applications or social media posts. Let it gather data for 1-2 weeks without changing anything.
Action Item: Record your initial metrics. What's your average CTR on project links? What's your primary traffic source? Set simple, measurable goals for your first iteration, like "Increase the CTR on my lead project case study by 10%."
Step 3: Analyze, Hypothesize, and Iterate
This is the core of the loop. Look at your data and ask strategic questions.
- Scenario: Your "Contact Me" button has a very low CTR.
- Hypothesis: The button might be visually lost, or the text ("Contact") isn't compelling enough for a recruiter who is just browsing.
- Iteration (A/B Test): Create two versions.
- Version A: Keep the green "Contact Me" button.
- Version B: Change it to a more action-oriented, high-contrast red button that says "Schedule an Intro Call."
- Test: Use a simple A/B testing tool (some portfolio builders offer this) or change the button for a set period (e.g., two weeks) and monitor the CTR.
Common Data Patterns & Actions:
| Data Pattern | Possible Insight | Action to Test |
|---|---|---|
| High traffic from LinkedIn, low project CTR | Visitors are curious but your projects aren't compelling at first glance. | Rewrite project headlines and hero images to be more benefit-oriented. |
| High CTR on one specific tech skill tag | Recruiters are actively filtering for this skill. | Feature projects using that skill more prominently, or add a dedicated skills section. |
| High bounce rate from a specific job board | Your portfolio doesn't match the expectations set by your application. | Tailor a "featured project" on your homepage to align with jobs from that board. |
| Most clicks are on PDF resumes, not web case studies | Recruiters prefer a traditional, downloadable format for quick sharing. | Ensure your PDF resume is always updated and easily accessible. |
Step 4: Close the Loop with Proactive Outreach
Your portfolio data can also guide your outbound job search.
- See a company IP address spending 10 minutes on your page? That's a hot lead. Follow up with a personalized LinkedIn connection request: "Hi [Name], I noticed someone from [Company] was checking out my work on [Project X]. It's a space I'm deeply interested in. I'd love to learn more about what your team is working on."
- Notice a trend of recruiters clicking your "Open Source Contributions" link? Highlight that experience in your next cover letter for similar roles. Your GitHub contribution graph and Stack Overflow profile become part of your proof of work narrative.
This turns passive viewing into an active conversation starter.
Real-World Applications: From Data to Job Offer
Professionals who iterate on portfolio data consistently outperform those who don't. Below are two scenarios illustrating how a single data insight -- like a low click-through rate on live demos -- can lead directly to a job offer when acted upon.
Let's look at two hypothetical examples of the feedback loop in action.
Case Study 1: The Front-End Developer
- Problem: Maya, a front-end dev, wasn't getting callbacks despite strong traffic from LinkedIn and Dribbble.
- Data: Analytics showed 80% of clicks were on her "Code Samples" (GitHub) link, but only 5% on her "Live Demo" links. Recruiters were checking her code but not seeing the final product.
- Hypothesis: The "Live Demo" links were buried or not enticing.
- Iteration: She moved the "Live Demo" button to the top of each project card and replaced the text with interactive labels like "View Interactive Prototype."
- Result: Live Demo CTR increased to 25%. In her next interview, a hiring manager commented, "I loved playing with the prototype on your portfolio—it really showed off the UX thinking." She received an offer shortly after.
Case Study 2: The Marketing Strategist
- Problem: David, a marketing lead, had a long, text-heavy case study that saw low engagement.
- Data: Heatmap analysis revealed almost no clicks on the "Results" section expandable text. Visitors scrolled quickly past it.
- Hypothesis: The results were hidden and not visually impactful.
- Iteration: He replaced the expandable text with a bold, central graphic showcasing key metrics (e.g., "+350% Lead Growth") using an icon-based infographic.
- Result: Time spent on that case study page increased by 3x. He started receiving interview requests that specifically mentioned being impressed by his data-driven results presentation.
Tools and Platforms to Enable Your Loop
The fastest path is a portfolio builder with built-in, privacy-compliant analytics -- tools like Popout, Google Analytics, Hotjar for heatmaps, or Plausible for lightweight, GDPR-friendly tracking. The key is link-click tracking on every button and project card.
While you can piece together a system with Google Analytics and other tools, using a platform built for this purpose saves immense time and complexity.
When evaluating portfolio builders, prioritize those with:
- Built-in, intuitive analytics: No coding or complex tagging required.
- Link-click tracking: The ability to see CTR on every button and link is non-negotiable.
- Clean data presentation: Dashboards that help you see trends at a glance, not just raw numbers.
- Privacy compliance: Tools that respect visitor privacy (like anonymizing IP addresses) are essential.
For a comprehensive look at the landscape, including how different platforms handle analytics, check out our Ultimate Guide to Portfolio Builder Alternatives in 2026.
Platforms like Popout are designed with this feedback loop in mind, integrating analytics directly into the page creation workflow, making it simple to go from data to design decision in minutes.
The Ethical Use of Data
Ethical portfolio analytics means using aggregate, anonymized behavior data -- never tracking individuals. Regulations like GDPR and CCPA set the legal floor, but best practice goes further by defaulting to IP anonymization and transparent privacy policies.
As you embrace data, do so responsibly.
- Be Transparent: Have a clear, accessible privacy policy if you're collecting data.
- Anonymize: Use tools that anonymize visitor IP addresses by default. You're interested in aggregate behavior, not spying on individuals.
- Focus on Aggregates: Make decisions based on trends (e.g., "30% of visitors click this") not on the behavior of a single person.
Conclusion: Your Portfolio as a Strategic Asset
Your portfolio is one of your most powerful career assets. By implementing a Portfolio Feedback Loop, you transform it from a static monument into a dynamic, learning engine for your professional brand. You stop relying on intuition and start leveraging evidence. You move from hoping recruiters understand your value to actively demonstrating it in the way they prefer to consume it.
In 2026, the candidates who stand out won't just have beautiful portfolios—they'll have intelligent ones. They'll be the ones who can say, "The data shows my work in X resonates most with leaders in your industry, which is why I've highlighted it here." That is a powerful, differentiated message.
Ready to stop guessing and start knowing? Create Your Popout Page today and unlock the built-in analytics you need to start your own feedback loop. For more strategies on building a standout presence, visit our central resource on portfolio development. You might also want to explore how a weekly portfolio refresh keeps your feedback loop running, or learn why your portfolio's digital body language might be undermining your data.
Frequently Asked Questions (FAQ)
Do recruiters actually care about portfolio analytics, or is this just for my own insight?
While recruiters themselves may not ask to see your analytics dashboard, the impact of using analytics is what they care about. A data-optimized portfolio is simply more effective—it's clearer, highlights the most relevant work, and provides a better user experience. This leads to higher engagement from the recruiter, which directly increases your chances of an interview. The analytics are your tool to create that superior portfolio.
I'm not a designer or data analyst. Is this process too technical for me?
Not at all. The goal isn't to become a data scientist. Modern portfolio builders with integrated analytics (like Popout) present data in simple, visual dashboards. The process is about asking basic questions: "What's my most-clicked project?" and then making a simple change like moving it higher on the page. The technical heavy lifting is handled by the platform.
How long should I run an A/B test on my portfolio before making a decision?
For portfolio traffic, which is often lower volume than a commercial website, a good rule of thumb is to run a test for a minimum of 2-3 weeks or until you have at least 100-200 views on the tested variation. This helps ensure your results aren't skewed by a single day's traffic or a very small sample size. Look for clear trends (e.g., a consistent 15% higher CTR) rather than tiny, day-to-day fluctuations.
Is it ethical to track who visits my portfolio?
Ethical tracking focuses on aggregate, anonymized behavior to improve your site—not on identifying individuals. Reputable tools anonymize IP addresses and don't collect personally identifiable information (PII). You are tracking what people do (e.g., 40% clicked link A) not who did it. Always use a platform that is transparent about its data practices and compliant with regulations like GDPR.
Can I use this feedback loop approach if I'm using a included platform like GitHub Pages or Notion?
Yes, but with more effort. You can embed tools like Google Analytics or a simple click-tracking script on a self-hosted site (like GitHub Pages). For platforms like Notion, your options are extremely limited as you cannot add custom tracking code. This is a key limitation that often pushes serious professionals towards dedicated portfolio builders that offer analytics as a core, integrated feature.
Besides job search, what are other benefits of a portfolio feedback loop?
The loop cultivates a product mindset towards your own career. You learn what your "market" (employers, clients) values, which informs the skills you choose to develop and the projects you pursue. It's invaluable for freelancers to see which services get the most interest, for speakers to see which talks attract event organizers, and for creators to understand what drives their audience to engage with their other work.
Other Doved Studio projects
Related tools from the same studio you might find useful:
- Ralphable: Generate structured Claude Code skills that iterate until pass/fail criteria are met.
- Glean: Turn scrolling time into a daily action plan. Capture, process, execute.
- Doved Studio: Studio indie derrière cette app et une dizaine d'autres outils.
Written by
popout
Content Team